この章では表の数値をグラフにする方法について説明します。
では次のデータをグラフにしますので、以下の通り、選択してください(青く変わっている箇所)。 次に「挿入」タブの中の
![]() をクリックしてください。
をクリックしてください。
クリックしますと次のメニューが開きます。
この中には色々なバージョンがあるのですが、今回は次の赤枠をクリックしてください。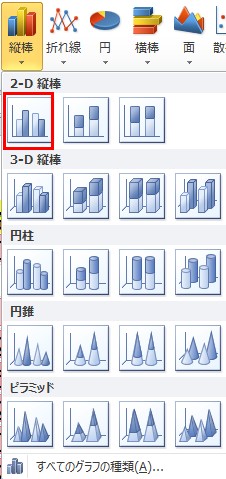 クリックしますとこのように自動でグラフを作成してくれます。
このグラフでは月別の各商品ごとの合計を示しています。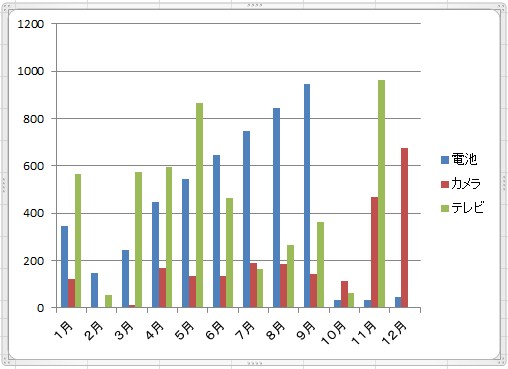
表の数値をグラフにしてみよう
URL :
TRACKBACK URL :
Warning: Undefined variable $aria_req in /home/a11926240/wordexcelpowerpoint1.com/public_html/wp-content/themes/dp-elplano/comments.php on line 139
Warning: Undefined variable $aria_req in /home/a11926240/wordexcelpowerpoint1.com/public_html/wp-content/themes/dp-elplano/comments.php on line 141
Warning: Undefined variable $post_id in /home/a11926240/wordexcelpowerpoint1.com/public_html/wp-content/themes/dp-elplano/comments.php on line 149
Warning: Undefined variable $post_id in /home/a11926240/wordexcelpowerpoint1.com/public_html/wp-content/themes/dp-elplano/comments.php on line 150
Warning: Undefined variable $post_id in /home/a11926240/wordexcelpowerpoint1.com/public_html/wp-content/themes/dp-elplano/comments.php on line 161
LEAVE A REPLY